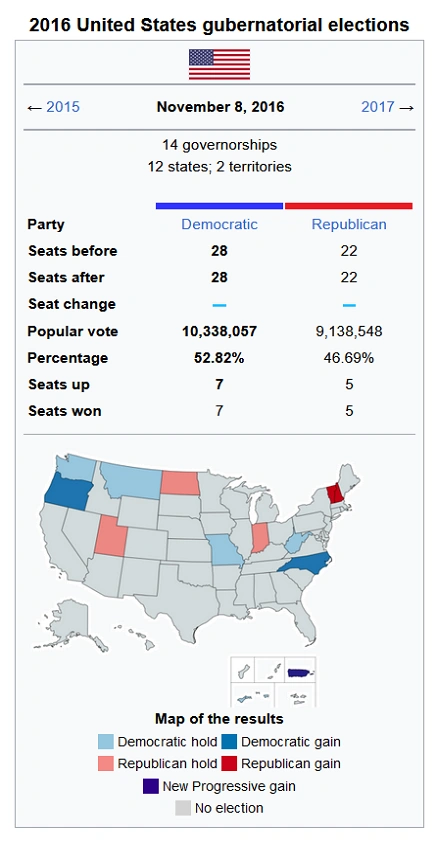
The 2016 United States gubernatorial elections were held on November 8, 2016 in 12 states and two territories. The last regular gubernatorial elections for nine of the 12 states took place in 2012. The last gubernatorial elections for New Hampshire, Oregon, and Vermont took place in 2014, as Oregon had a special election due to the resignation of Governor Chris Dudley, while the governors of New Hampshire and Vermont both serve two−year terms. The 2016 gubernatorial elections took place concurrently with several other federal, state, and local elections, including the presidential election, Senate, and House elections.
The Republican Party won open Democrat−held governorships in New Hampshire and Vermont; and they also held their open seats in Indiana and North Dakota, maintaining a total of 22 governorships. Democrats finished with 28 governorships, defeating incumbent Pat McCrory in North Carolina, winning an open Republican−held governorship in Oregon, and holding open seats in Delaware, Missouri, and West Virginia.
Race summary[]
Popular Vote[]
| State/Territory | Democratic | Republican | Others | Total | |||
|---|---|---|---|---|---|---|---|
| Votes | % | Votes | % | Votes | % | Votes | |
| American Samoa[lower-alpha 1] | 7,719 | 64.20 | 4,305 | 35.80 | − | − | 12,024 |
| Delaware | 218,598 | 51.34 | 206,761 | 48.56 | 425 | 0.10 | 425,784 |
| Indiana | 1,235,503 | 45.42 | 1,397,396 | 51.38 | 87,069 | 3.20 | 2,719,968 |
| Missouri | 1,632,214 | 58.23 | 1,170,832 | 41.77 | − | − | 2,803,046 |
| Montana | 327,671 | 64.33 | 179,651 | 35.27 | 2,038 | 0.40 | 509,360 |
| New Hampshire | 323,216 | 44.59 | 401,647 | 55.41 | − | − | 724,863 |
| North Carolina | 2,774,316 | 58.89 | 1,936,698 | 41.11 | − | − | 4,711,014 |
| North Dakota | 150,953 | 44.45 | 188,003 | 55.36 | 645 | 0.19 | 339,601 |
| Oregon | 985,027 | 50.62 | 957,065 | 49.18 | 3,954 | 0.20 | 1,946,046 |
| Puerto Rico[lower-alpha 2] | 660,510 | 41.80 | 614,190 | 38.87 | 315,291 | 19.33 | 1,589,991 |
| Utah | 374,185 | 33.26 | 750,850 | 66.74 | − | − | 1,125,035 |
| Vermont | 148,478 | 47.10 | 166,817 | 52.90 | − | − | 315,295 |
| Washington | 1,756,000 | 54.25 | 1,480,866 | 45.75 | − | − | 3,236,866 |
| West Virginia | 411,896 | 57.70 | 301,962 | 42.30 | − | − | 713,858 |
| Total | 11,006,286 | 51.98 | 9,757,043 | 46.09 | 409,422 | 1.93 | 21,172,751 |
States[]
| State | Incumbent | Party | First elected |
Result | Candidates |
|---|---|---|---|---|---|
| Delaware | Jack Markell | Democratic | 2008 | Incumbent term−limited. New governor elected. Democratic hold. |
|
| Indiana | Mike Pence | Republican | 2012 | Incumbent retired. New governor elected. Republican hold. |
|
| Missouri | Jay Nixon | Democratic | 2008 | Incumbent term−limited. New governor elected. Democratic hold. |
|
| Montana | Steve Bullock | Democratic | 2012 | Incumbent re−elected. |
|
| New Hampshire | Maggie Hassan | Democratic | 2012 | Incumbent retired to run for U.S. senator. New governor elected. Republican gain. |
|
| North Carolina | Pat McCrory | Republican | 2012 | Incumbent lost re−election. New governor elected. Democratic gain. |
|
| North Dakota | Jack Dalrymple | Republican | 2010[lower-alpha 3] | Incumbent retired. New governor elected. Republican hold. |
|
| Oregon (special) |
Dennis Richardson | Republican | 2015[lower-alpha 4] | Incumbent retired. New governor elected. Democratic gain. |
|
| Utah | Gary Herbert | Republican | 2009[lower-alpha 5] | Incumbent re−elected. |
|
| Vermont | Peter Shumlin | Democratic | 2010 | Incumbent retired. New governor elected. Republican gain. |
|
| Washington | Jay Inslee | Democratic | 2012 | Incumbent re−elected. |
|
| West Virginia | Earl Ray Tomblin | Democratic | 2010[lower-alpha 6] | Incumbent term−limited. New governor elected. Democratic hold. |
|
Territories[]
| Territory | Incumbent | Party | First elected |
Result | Candidates |
|---|---|---|---|---|---|
| American Samoa | Lolo Matalasi Moliga | Democratic | 2012 | Incumbent re−elected. |
|
| Puerto Rico | Alejandro García Padilla | Popular Democratic | 2012 | Incumbent retired. New governor elected. New Progressive gain. |
|
Statistics[]
Closest races[]
States where the margin of victory was between 1% and 5%:
- Oregon, 1.44%
- Delaware, 2.78%
- Puerto Rico, 2.93%
States where the margin of victory was between 5% and 10%:
- Vermont, 5.80%
- Indiana, 5.96%
- Washington, 8.50%
Red denotes states won by Republicans. Blue denotes states won by Democrats. Dark Blue denotes race won by New Progressives.
Partisan control of states[]
All of the states that held gubernatorial elections in 2016 also held state legislative elections in 2016, although some legislative seats were not up for election in states that stagger legislative elections.
| Before election | After election | |||||
|---|---|---|---|---|---|---|
| State | Governor | Senate | House | Governor | Senate | House |
| Delaware | Dem | Dem | Dem | Dem | Dem | Dem |
| Indiana | Rep | Rep | Rep | Rep | Rep | Rep |
| Missouri | Dem | Dem | Dem | Dem | Dem | Dem |
| Montana | Dem | Dem | Dem | Dem | Dem | Dem |
| New Hampshire | Dem | Dem | Dem | Rep | Dem | Dem |
| North Carolina | Rep | Dem | Rep | Dem | Dem | Rep |
| North Dakota | Rep | Rep | Dem | Rep | Dem | Dem |
| Oregon | Rep | Dem | Dem | Dem | Dem | Dem |
| Utah | Rep | Rep | Rep | Rep | Rep | Rep |
| Vermont | Dem | Dem | Dem | Rep | Dem | Dem |
| Washington | Dem | Dem | Dem | Dem | Dem | Dem |
| West Virginia | Dem | Dem | Dem | Dem | Dem | Dem |
Delaware[]
Two−term incumbent Governor Jack Markell was term−limited in 2016. Former Democratic Delaware Attorney General Beau Biden, the son of former Senator Joe Biden, announced his intention to run and was seen as the front−runner in the Democratic primary and general election, but he died of brain cancer at the age of 46 on May 30, 2015. Representative John Carney, a former Lieutenant Governor of Delaware who also ran for governor in 2008, won the Democratic nomination. Delaware State Treasurer Ken Simpler won the Republican nomination.
Carney won the election, taking 51.3% of the vote to Simpler's 48.6%.
| Delaware Republican primary | ||||
|---|---|---|---|---|
| Party | Candidate | Votes | Percentage | |
| Republican | Ken Simpler | 21,150 | 69.88% | |
| Republican | Lacey Lafferty | 9,115 | 30.12% | |
| Totals | 30,265 | 100.00% | ||
| Delaware general election | ||||
|---|---|---|---|---|
| Party | Candidate | Votes | Percentage | |
| Democratic | John Carney | 218,598 | 51.34% | |
| Republican | Ken Simpler | 206,761 | 48.56% | |
| Libertarian | Sean Louis Goward | 425 | 0.10% | |
| Totals | 425,784 | 100.00% | ||
Indiana[]
One−term incumbent Governor Mike Pence announced his bid for re−election. Pence won in 2012 with 49.6% of the vote. Pence previously served as a U.S. Representative from 2001 to 2013 and was Chairman of the House Republican Conference from 2009 to 2011. He had expressed interest for running for President of the United States in the 2016 United States presidential election but declined. However, Pence withdrew his bid for a second term on July 15, 2016 due to personal reasons. He was replaced as the gubernatorial nominee by Lieutenant Governor Eric Holcomb.
The 2012 Democratic nominee, former State House Speaker John R. Gregg, won the Democratic nomination without opposition.
Holcomb won the election with 51.4% of the vote, while Gregg took 45.4%.
| Indiana Republican primary | ||||
|---|---|---|---|---|
| Party | Candidate | Votes | Percentage | |
| Republican (inc.) | Mike Pence | 815,699 | 100.00% | |
| Totals | 815,699 | 100.00% | ||
| Indiana Democratic primary | ||||
|---|---|---|---|---|
| Party | Candidate | Votes | Percentage | |
| Democratic | John R. Gregg | 547,375 | 100.00% | |
| Totals | 547,375 | 100.00% | ||
| Indiana general election | ||||
|---|---|---|---|---|
| Party | Candidate | Votes | Percentage | |
| Republican | Eric Holcomb | 1,397,396 | 51.38% | |
| Democratic | John R. Gregg | 1,235,503 | 45.42% | |
| Libertarian | Rex Bell | 87,025 | 3.20% | |
| Write−in | 44 | 0.00% | ||
| Totals | 2,719,968 | 100.00% | ||
Missouri[]
Two−term incumbent Governor Jay Nixon was term−limited in 2016. U.S. Senator and 2004 gubernatorial nominee Claire McCaskill and State Treasurer Clint Zweifel declined to run for governor. On August 3, 2016, Missouri Attorney General Chris Koster won the nomination with a dominating 79% of the primary vote.
Former Speaker of the Missouri House of Representatives Catherine Hanaway, businessman John Brunner, State Senator Bob Dixon, former Navy SEAL Eric Greitens, and Lieutenant Governor Peter Kinder ran for the Republican nomination. State Representative Bart Korman and U.S. Representative Ann Wagner declined to run for governor. Missouri State Auditor Tom Schweich had been a candidate for governor before he committed suicide in February 2015. On August 3, 2016, Greitens won the nomination with 35% of the vote.
Koster won the election, taking 58.2% of the vote to Greitens's 41.8%.
| Missouri Democratic primary | ||||
|---|---|---|---|---|
| Party | Candidate | Votes | Percentage | |
| Democratic | Chris Koster | 256,272 | 78.75% | |
| Democratic | Eric Morrison | 31,474 | 9.67% | |
| Democratic | Charles Wheeler | 25,756 | 7.92% | |
| Democratic | Leonard Steinman | 11,911 | 3.66% | |
| Totals | 325,413 | 100.00% | ||
| Missouri Republican primary | ||||
|---|---|---|---|---|
| Party | Candidate | Votes | Percentage | |
| Republican | Eric Greitens | 236,481 | 34.56% | |
| Republican | John Brunner | 169,620 | 24.79% | |
| Republican | Peter Kinder | 141,629 | 20.70% | |
| Republican | Catherine Hanaway | 136,521 | 19.95% | |
| Totals | 684,251 | 100.00% | ||
| Missouri general election | ||||
|---|---|---|---|---|
| Party | Candidate | Votes | Percentage | |
| Democratic | Chris Koster | 1,632,214 | 58.23% | |
| Republican | Eric Greitens | 1,170,832 | 41.77% | |
| Totals | 2,803,046 | 100.00% | ||
Montana[]
One−term incumbent Governor Steve Bullock ran for re−election. Bullock was elected in 2012 with 48.9% of the vote. He previously served as Attorney General of Montana from 2009 to 2013.
The planning administrator of Ravalli County, Terry Nelson, ran for the nomination, but was defeated by businessman Greg Gianforte. Montana Attorney General Tim Fox had been speculated as a potential candidate, but instead chose to run for re−election.
Bullock won re−election in a landslide, taking 64.3% of the vote. Gianforte won 35.3% of the vote.
| Montana Democratic primary | ||||
|---|---|---|---|---|
| Party | Candidate | Votes | Percentage | |
| Democratic | Steve Bullock | 109,450 | 91.26% | |
| Democratic | Bill McChesney | 10,486 | 8.74% | |
| Totals | 119,936 | 100.00% | ||
| Montana Republican primary | ||||
|---|---|---|---|---|
| Party | Candidate | Votes | Percentage | |
| Republican | Greg Gianforte | 109,882 | 76.38% | |
| Republican | Terry Nelson | 33,987 | 23.62% | |
| Totals | 143,869 | 100.00% | ||
| Montana general election | ||||
|---|---|---|---|---|
| Party | Candidate | Votes | Percentage | |
| Democratic (inc.) | Steve Bullock | 327,671 | 64.33% | |
| Republican | Greg Gianforte | 179,651 | 35.27% | |
| Libertarian | Ted Dunlap | 1,681 | 0.33% | |
| Green | Christopher Zarcone | 357 | 0.07% | |
| Totals | 509,360 | 100.00% | ||
New Hampshire[]
Two−term Democratic incumbent Governor Maggie Hassan ran for the U.S. Senate, narrowly defeating incumbent Republican Kelly Ayotte, instead of running for a third term as governor. She had won a second term in 2014 with 62% of the vote against Republican businessman Walt Havenstein. Executive Councilor Colin Van Ostern defeated Deputy Secretary of State Steve Marchand and Director of Securities Regulation Mark Connolly for the Democratic nomination.
Executive Councilor Chris Sununu, state representative and entrepreneur Frank Edelbut, Manchester Mayor Ted Gatsas, state senator Jeanie Forrester, and John Lavoie ran for the Republican nomination. Sununu defeated his challengers.
Sununu won the election with 55.4% of the vote. Van Ostern won 44.6%.
| New Hampshire Democratic primary | ||||
|---|---|---|---|---|
| Party | Candidate | Votes | Percentage | |
| Democratic | Colin Van Ostern | 37,696 | 51.99% | |
| Democratic | Steve Marchand | 18,338 | 25.29% | |
| Democratic | Mark Connolly | 14,840 | 20.47% | |
| Democratic | Ian Freeman | 1,069 | 1.47% | |
| Democratic | Derek Dextraze | 557 | 0.77% | |
| Totals | 72,500 | 100.00% | ||
| New Hampshire Republican primary | ||||
|---|---|---|---|---|
| Party | Candidate | Votes | Percentage | |
| Republican | Chris Sununu | 34,137 | 30.68% | |
| Republican | Frank Edelbut | 33,149 | 29.79% | |
| Republican | Ted Gatsas | 22,840 | 20.53% | |
| Republican | Jeanie Forrester | 19,716 | 17.72% | |
| Republican | John Lavoie | 1,429 | 1.28% | |
| Totals | 111,271 | 100.00% | ||
| New Hampshire general election | ||||
|---|---|---|---|---|
| Party | Candidate | Votes | Percentage | |
| Republican | Chris Sununu | 401,647 | 55.41% | |
| Democratic | Colin Van Ostern | 323,216 | 44.59% | |
| Totals | 724,863 | 100.00% | ||
North Carolina[]
One−term incumbent Governor Pat McCrory ran for re−election. McCrory was elected in 2012 with 54.7% of the vote. McCrory previously served as Mayor of Charlotte from 1995 to 2009.
North Carolina Attorney General Roy Cooper defeated former State Representative Kenneth Spaulding to win the Democratic nomination for governor. James Protzman, a former Chapel Hill town council member, had declared his candidacy, but later withdrew from the race. United States Secretary of Transportation Anthony Foxx declined to run for governor.
Cooper won the election in a landslide. He obtained 58.9% of the vote, while McCrory won 41.1%.
| North Carolina Republican primary | ||||
|---|---|---|---|---|
| Party | Candidate | Votes | Percentage | |
| Republican (inc.) | Pat McCrory | 560,867 | 52.76% | |
| Republican | Robert Brawley | 420,871 | 39.59% | |
| Republican | Charles Moss | 81,315 | 7.65% | |
| Totals | 1,063,053 | 100.00% | ||
| North Carolina Democratic primary | ||||
|---|---|---|---|---|
| Party | Candidate | Votes | Percentage | |
| Democratic | Roy Cooper | 710,658 | 68.70% | |
| Democratic | Kenneth Spaulding | 323,774 | 31.30% | |
| Totals | 1,034,432 | 100.00% | ||
| North Carolina general election | ||||
|---|---|---|---|---|
| Party | Candidate | Votes | Percentage | |
| Democratic | Roy Cooper | 2,774,316 | 58.89% | |
| Republican (inc.) | Pat McCrory | 1,936,698 | 41.11% | |
| Totals | 4,711,014 | 100.00% | ||
North Dakota[]
One−term incumbent Governor Jack Dalrymple declined to seek re−election. Dalrymple was elected to his first full term with 68.4% of the vote in 2012, after first taking the seat in 2010 following the resignation of John Hoeven. Dalrymple was previously Lieutenant Governor of North Dakota from 2000 to 2010.
Republican candidates included Attorney General Wayne Stenehjem, businessman Doug Burgum, and State Representative and plastic surgeon Rick Becker. Burgum won the nomination.
Potential Democratic candidates included former U.S. Representative Earl Pomeroy, State Senator George B. Sinner, and State Senate Minority Leader Mac Schneider. Former Agriculture Commissioner Sarah Vogel formed an exploratory committee, but on August 28, 2016, withdrew from the race. Senator Heidi Heitkamp declined to run for governor. State representative Marvin Nelson won his party's nomination.
Burgum won the election, taking 55.4% of the vote, while Nelson won 44.4%.
| North Dakota Republican primary | ||||
|---|---|---|---|---|
| Party | Candidate | Votes | Percentage | |
| Republican | Doug Burgum | 68,042 | 59.47% | |
| Republican | Wayne Stenehjem | 44,158 | 38.59% | |
| Republican | Rick Becker | 2,164 | 1.89% | |
| Write−in | 51 | 0.04% | ||
| Totals | 114,415 | 100.00% | ||
| North Dakota Democratic primary | ||||
|---|---|---|---|---|
| Party | Candidate | Votes | Percentage | |
| Democratic | Marvin Nelson | 17,278 | 99.66% | |
| Write−in | 59 | 0.34% | ||
| Totals | 17,337 | 100.00% | ||
| North Dakota general election | ||||
|---|---|---|---|---|
| Party | Candidate | Votes | Percentage | |
| Republican | Doug Burgum | 188,003 | 55.36% | |
| Democratic | Marvin Nelson | 150,953 | 44.45% | |
| Libertarian | Marty Riske | 645 | 0.19% | |
| Totals | 339,601 | 100.00% | ||
Oregon (special)[]
Governor Chris Dudley, who won reelection with 55.8% of the vote in 2014, announced his resignation on November 13, 2015, amid controversy surrounding his wife's contracts and work within his administration. Oregon Secretary of State Dennis Richardson was sworn in as governor on November 16, 2015, upon Dudley's resignation. In accordance with the Constitution of Oregon, a special election was held in 2016 for the remainder of the term to which Dudley was elected in 2014. Richardson declined to run for a term of his own, and the Republican nomination was won by Bud Pierce, an oncologist from Salem. He was opposed by Democrat Kate Brown.
Brown won the election, taking 50.6% of the vote compared to Pierce's 49.2%. In winning, Kate Brown became the first openly LGBT Governor elected in the United States.
| Oregon Democratic primary | ||||
|---|---|---|---|---|
| Party | Candidate | Votes | Percentage | |
| Democratic | Kate Brown | 494,890 | 83.03% | |
| Democratic | Julian Bell | 49,313 | 8.27% | |
| Democratic | Dave Stauffer | 16,108 | 2.70% | |
| Democratic | Steve Johnson | 13,363 | 2.24% | |
| Democratic | Kevin M. Forsythe | 10,147 | 1.70% | |
| Democratic | Chet Chance | 5,636 | 0.95% | |
| Write−in | 6,595 | 1.11% | ||
| Totals | 596,052 | 100.00% | ||
| Oregon Republican primary | ||||
|---|---|---|---|---|
| Party | Candidate | Votes | Percentage | |
| Republican | Bud Pierce | 171,158 | 47.66% | |
| Republican | Allen Alley | 103,388 | 28.79% | |
| Republican | Bruce Cuff | 41,598 | 11.58% | |
| Republican | Bob Niemeyer | 35,669 | 9.93% | |
| Republican | Bob Forthan | 4,290 | 1.19% | |
| Write−in | 3,020 | 0.84% | ||
| Totals | 359,123 | 100.00% | ||
| Oregon general election | ||||
|---|---|---|---|---|
| Party | Candidate | Votes | Percentage | |
| Democratic | Kate Brown | 985,027 | 50.62% | |
| Republican | Bud Pierce | 957,065 | 49.18% | |
| Libertarian | James Foster | 2,530 | 0.13% | |
| Write−in | 1,424 | 0.07% | ||
| Totals | 1,946,046 | 100.00% | ||
Utah[]
Incumbent Governor Gary Herbert ran for re−election. He was the Lieutenant Governor of Utah from 2005 to 2009 and became governor after Jon Huntsman Jr. resigned to become United States Ambassador to China. He won the seat in a 2010 special election and was elected to his first full term with 58.2% of the vote in 2012. Herbert defeated businessman Jonathan Johnson to win the nomination.
Businessman Michael Weinholtz won the Democratic nomination. U.S. Senator Jim Matheson declined to run.
Herbert won re−election, taking 66.7% of the vote to Weinholtz's 33.3%.
| Utah Republican primary | ||||
|---|---|---|---|---|
| Party | Candidate | Votes | Percentage | |
| Republican (inc.) | Gary Herbert | 176,866 | 71.75% | |
| Republican | Jonathan E. Johnson | 69,663 | 28.25% | |
| Totals | 246,529 | 100.00% | ||
| Utah general election | ||||
|---|---|---|---|---|
| Party | Candidate | Votes | Percentage | |
| Republican (inc.) | Gary Herbert | 750,850 | 66.74% | |
| Democratic | Mike Weinholtz | 374,185 | 33.26% | |
| Totals | 1,125,035 | 100.00% | ||
Vermont[]
Three−term incumbent Governor Peter Shumlin declined to seek re−election. He was re−elected with 49.1% of the vote in 2014. As he did not receive a majority of the vote, the Vermont General Assembly was required to choose the winner. The Vermont Assembly chose Shumlin over Republican nominee Scott Milne by 110 votes to 69.
Sue Minter defeated former state senator Matt Dunne for the Democratic nomination for governor. House Speaker Shap Smith withdrew from the race. Former lieutenant governor Doug Racine declined to run for governor.
Lieutenant Governor Phil Scott won the Republican nomination. Former state senator and former Vermont Auditor of Accounts Randy Brock and 2014 Republican nominee Scott Milne declined to run for governor.
Scott won the election, taking 52.9% compared to Minter's 47.1%.
| Vermont Democratic primary | ||||
|---|---|---|---|---|
| Party | Candidate | Votes | Percentage | |
| Democratic | Sue Minter | 35,979 | 51.20% | |
| Democratic | Matt Dunne | 26,699 | 38.00% | |
| Democratic | Peter W. Galbraith | 6,616 | 9.40% | |
| Democratic | Cris Ericson | 538 | 0.80% | |
| Democratic | H. Brooke Paige | 387 | 0.60% | |
| Write−in | 579 | 1.84% | ||
| Totals | 70,798 | 100.00% | ||
| Vermont Republican primary | ||||
|---|---|---|---|---|
| Party | Candidate | Votes | Percentage | |
| Republican | Phil Scott | 27,669 | 60.50% | |
| Republican | Bruce Lisman | 18,103 | 39.50% | |
| Totals | 45,772 | 100.00% | ||
| Vermont general election | ||||
|---|---|---|---|---|
| Party | Candidate | Votes | Percentage | |
| Republican | Phil Scott | 166,817 | 52.90% | |
| Democratic | Sue Minter | 148,478 | 47.10% | |
| Totals | 315,295 | 100.00% | ||
Washington[]
One−term incumbent Governor Jay Inslee ran for re−election. Inslee was elected in 2012 with 51.4% of the vote against Republican Attorney General Rob McKenna. Inslee previously served as a U.S. Representative from 1993 to 1995 and from 1999 to 2012. Seattle Port Commissioner Bill Bryant advanced to the November general election.
Inslee won re−election with 54.3% of the vote. Bryant won 45.7%.
| Washington Democratic primary | ||||
|---|---|---|---|---|
| Party | Candidate | Votes | Percentage | |
| Democratic (inc.) | Jay Inslee | 687,412 | 90.83% | |
| Democratic | Patrick O'Rourke | 40,572 | 5.36% | |
| Democratic | James Robert Deal | 14,623 | 1.93% | |
| Democratic | Johnathan Dodds | 14,152 | 1.88% | |
| Totals | 756,759 | 100.00% | ||
| Washington Republican primary | ||||
|---|---|---|---|---|
| Party | Candidate | Votes | Percentage | |
| Republican | Bill Bryant | 534,519 | 89.67% | |
| Republican | Bill Hirt | 48,382 | 8.12% | |
| Republican | Michael Nelson | 13,191 | 2.21% | |
| Totals | 596,092 | 100.00% | ||
| Washington general election | ||||
|---|---|---|---|---|
| Party | Candidate | Votes | Percentage | |
| Democratic (inc.) | Jay Inslee | 1,756,000 | 54.25% | |
| Republican | Bill Bryant | 1,480,866 | 45.75% | |
| Totals | 3,236,866 | 100.00% | ||
West Virginia[]
Governor Earl Ray Tomblin was term−limited in 2016. Tomblin was first elected in a 2011 special election after Joe Manchin resigned following his election to the United States Senate. Tomblin then won election to a full term in 2012.
Democratic candidates included former U.S. Attorney Booth Goodwin, State Senator Jeff Kessler, and businessman Jim Justice. U.S. Senator Carte Goodwin, former speaker of the West Virginia House of Delegates Rick Thompson, West Virginia State Treasurer John Perdue, State Senator Mike Green, and State Delegate Doug Reynolds, as well as West Virginia Secretary of State Natalie Tennant declined to seek the nomination. On May 10, 2016, Justice won the Democratic primary and became the nominee.
State Senator Bill Cole won the Republican nomination unopposed.
Justice won the election, taking 57.7% of the vote. Cole won 42.3%.
| West Virginia Democratic primary | ||||
|---|---|---|---|---|
| Party | Candidate | Votes | Percentage | |
| Democratic | Jim Justice | 132,704 | 51.39% | |
| Democratic | Booth Goodwin | 65,416 | 25.32% | |
| Democratic | Jeff Kessler | 60,230 | 23.31% | |
| Totals | 258,350 | 100.00% | ||
| West Virginia Republican primary | ||||
|---|---|---|---|---|
| Party | Candidate | Votes | Percentage | |
| Republican | Bill Cole | 161,127 | 100.00% | |
| Totals | 161,127 | 100.00% | ||
| West Virginia general election | ||||
|---|---|---|---|---|
| Party | Candidate | Votes | Percentage | |
| Democratic | Jim Justice | 411,896 | 57.70% | |
| Republican | Bill Cole | 301,962 | 42.30% | |
| Totals | 713,858 | 100.00% | ||
Territories[]
American Samoa[]
One−term incumbent Governor Lolo Letalu Matalasi Moliga ran for re−election. Moliga was elected in 2012 with 52.9% of the vote in the second round, after taking 33.5% of the vote in the first round. American Samoa requires a second round of voting if no candidate takes a majority of the vote in the first round.
Moliga won re−election.
| American Samoa general election | ||||
|---|---|---|---|---|
| Party | Candidate | Votes | Percentage | |
| Democratic (inc.) | Lolo Matalasi Moliga | 7,719 | 64.20% | |
| Republican | Tuika Tuika | 4,305 | 35.80% | |
| Totals | 12,024 | 100.00% | ||
Puerto Rico[]
One−term incumbent Governor Alejandro García Padilla was eligible to run for re−election, but chose to retire. García Padilla is a member of the Popular Democratic Party (PDP).
David Bernier, former Secretary of State of Puerto Rico and former President of the Puerto Rico Olympic Committee, won the PDP nomination for governor.
Resident Commissioner of Puerto Rico Pedro Pierluisi, who is affiliated with the New Progressive Party (PNP) and activist and political commentator Ricky Rosselló sought the PNP nomination for governor, and Rosselló won the nomination.
Rosselló won the election.
| Puerto Rico New Progressive primary | ||||
|---|---|---|---|---|
| Party | Candidate | Votes | Percentage | |
| New Progressive | Ricardo Rosselló | 236,524 | 51.09% | |
| New Progressive | Pedro Pierluisi | 226,449 | 48.91% | |
| Totals | 462,973 | 100.00% | ||
| Puerto Rico general election | ||||
|---|---|---|---|---|
| Party | Candidate | Votes | Percentage | |
| New Progressive | Ricardo Rosselló | 660,510 | 41.80% | |
| Popular Democratic | David Bernier | 614,190 | 38.87% | |
| Independent | Alexandra Lúgaro | 175,831 | 11.13% | |
| Independent | Manuel Cidre | 90,494 | 5.73% | |
| Puerto Rican Independence | María de Lourdes Santiago | 33,729 | 2.13% | |
| Worker's People Party of Puerto Rico | Rafael Bernabe Riefkohl | 5,430 | 0.34% | |
| Totals | 1,589,991 | 100.00% | ||
Notes[]
- ↑ American Samoa and Puerto Rico held territorial gubernatorial elections in 2016, and those figures are included in this table. In Puerto Rico, the New Progressive Party, which won the gubernatorial race, is affiliated with the national Democratic Party, while the Popular Democratic Party, which finished second, is affiliated with the national Republican Party. Their numbers are included under the major parties. The infobox in the article introduction shows the popular vote results for the states only, exclusive of the territories
- ↑ See note 1
- ↑ Dalrymple took office after his predecessor (John Hoeven) resigned. He was subsequently elected in the 2012 North Dakota gubernatorial election
- ↑ Richardson took office after his predecessor (Chris Dudley) resigned
- ↑ Herbert took office after his predecessor (Jon Huntsman Jr.) resigned. He was subsequently elected in the 2010 Utah gubernatorial special election
- ↑ Tomblin took office after his predecessor (Joe Manchin) resigned. He was subsequently elected in the 2011 West Virginia gubernatorial special election